
Software to better analyze super-resolution data
Single molecule localization super-resolution microscopy, awarded the 2014 Nobel Prize in Chemistry, is a microscopy technique that allows probing cellular intimacy with near-nanometric resolutions. Adopted by many biology laboratories, it is still underutilized, notably because of the pointillistic nature of its data. A new software, developed by Florian Levet (BIC) and Jean-Baptiste Sibarita (IINS), and published in the journal Nature Methods, offers the possibility to efficiently manipulate and quantify these data.
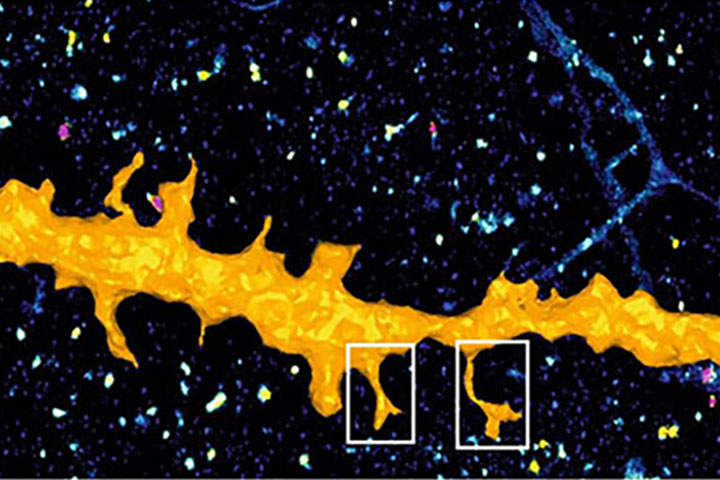
Single molecule localization super-resolution microscopy, or SRLMI, allows to reconstruct an image from the set of fluorophores coordinates. To do this, the strategy consists in activating only a very small fraction of the fluorophores present in the sample, in order to spatially isolate them and then to be able to localize them with computerized precision that can reach a few nanometers. The final image, called super-resolution, is then reconstructed from all the coordinates of the molecules extracted from thousands of successive images collected and analyzed.
Initially reserved for experts in microscopy and image analysis, SRLMI microscopy has rapidly become more widely used, allowing major advances in cell biology and neuroscience. It is now routinely used, offering scientists the ability to study the spatial organization of proteins within cells at the nanoscale, a resolution previously only accessible through electron microscopy. It also allows to follow precisely the dynamics of molecules with temporal resolutions of the order of milliseconds, whereas electron microscopy does not allow the observation of living samples.
Nevertheless, this microscopy technique is still under-exploited, notably because of the pointillistic nature and the quantity of data it generates. Indeed, super-resolution images can contain up to several million coordinates of molecules in 3 dimensions, making their manipulation and interpretation complex. Thus, most software solutions reconstruct intensity images from the location coordinates, allowing the use of traditional image visualization and analysis tools. However, this operation induces a considerable loss of information, namely the spatial and temporal coordinates of each tagged and localized protein.
In recent years, scientists have been working on the development of new analysis methods that can best exploit the pointillistic nature of location data. Nevertheless, these methods are not always accessible to non-experts, nor optimized when dealing with experimental data consisting of a large number of locations. This observation illustrates a flagrant lack of versatile and optimized tools allowing to integrate a maximum of analysis methods compatible with 2D, 3D and multi-color localization data.
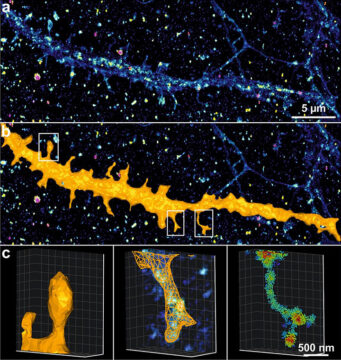
To address this shortcoming, scientists have developed PoCA (Point Cloud Analyst), a new software for multidimensional analysis of point clouds acquired in SRLMI. PoCA integrates an advanced 3D visualization engine, powerful manipulation and interaction capabilities, as well as fast and robust reference quantization techniques. Heir of the two previous software SR-TESSELER and COLOC-TESSELER, PoCA is based on an architecture accepting “plugins”, thus allowing the integration of existing and future methods of localization data analysis. It also integrates a Python interpreter and a macro execution engine, facilitating the prototyping of new methods and the reproducibility of analyses.
Reference
PoCA: a software platform for point cloud data visualization and quantification.
Florien Levet, Jean-Baptiste Sibarita
Nat Methods (2023).
DOI : https://doi.org/10.1038/s41592-023-01811-4
Contact
Jean-Baptiste Sibarita
Ingénieur de recherche CNRS, IINS
Last update 25/04/23